> ## Documentation Index
> Fetch the complete documentation index at: https://docs.subverseai.com/llms.txt
> Use this file to discover all available pages before exploring further.
# Performance Dashboard
> Analyze agent level performance
The Performance Dashboard provides insights into agent-level performance, helping you track efficiency, response times, and customer satisfaction.
 Key metrics include:
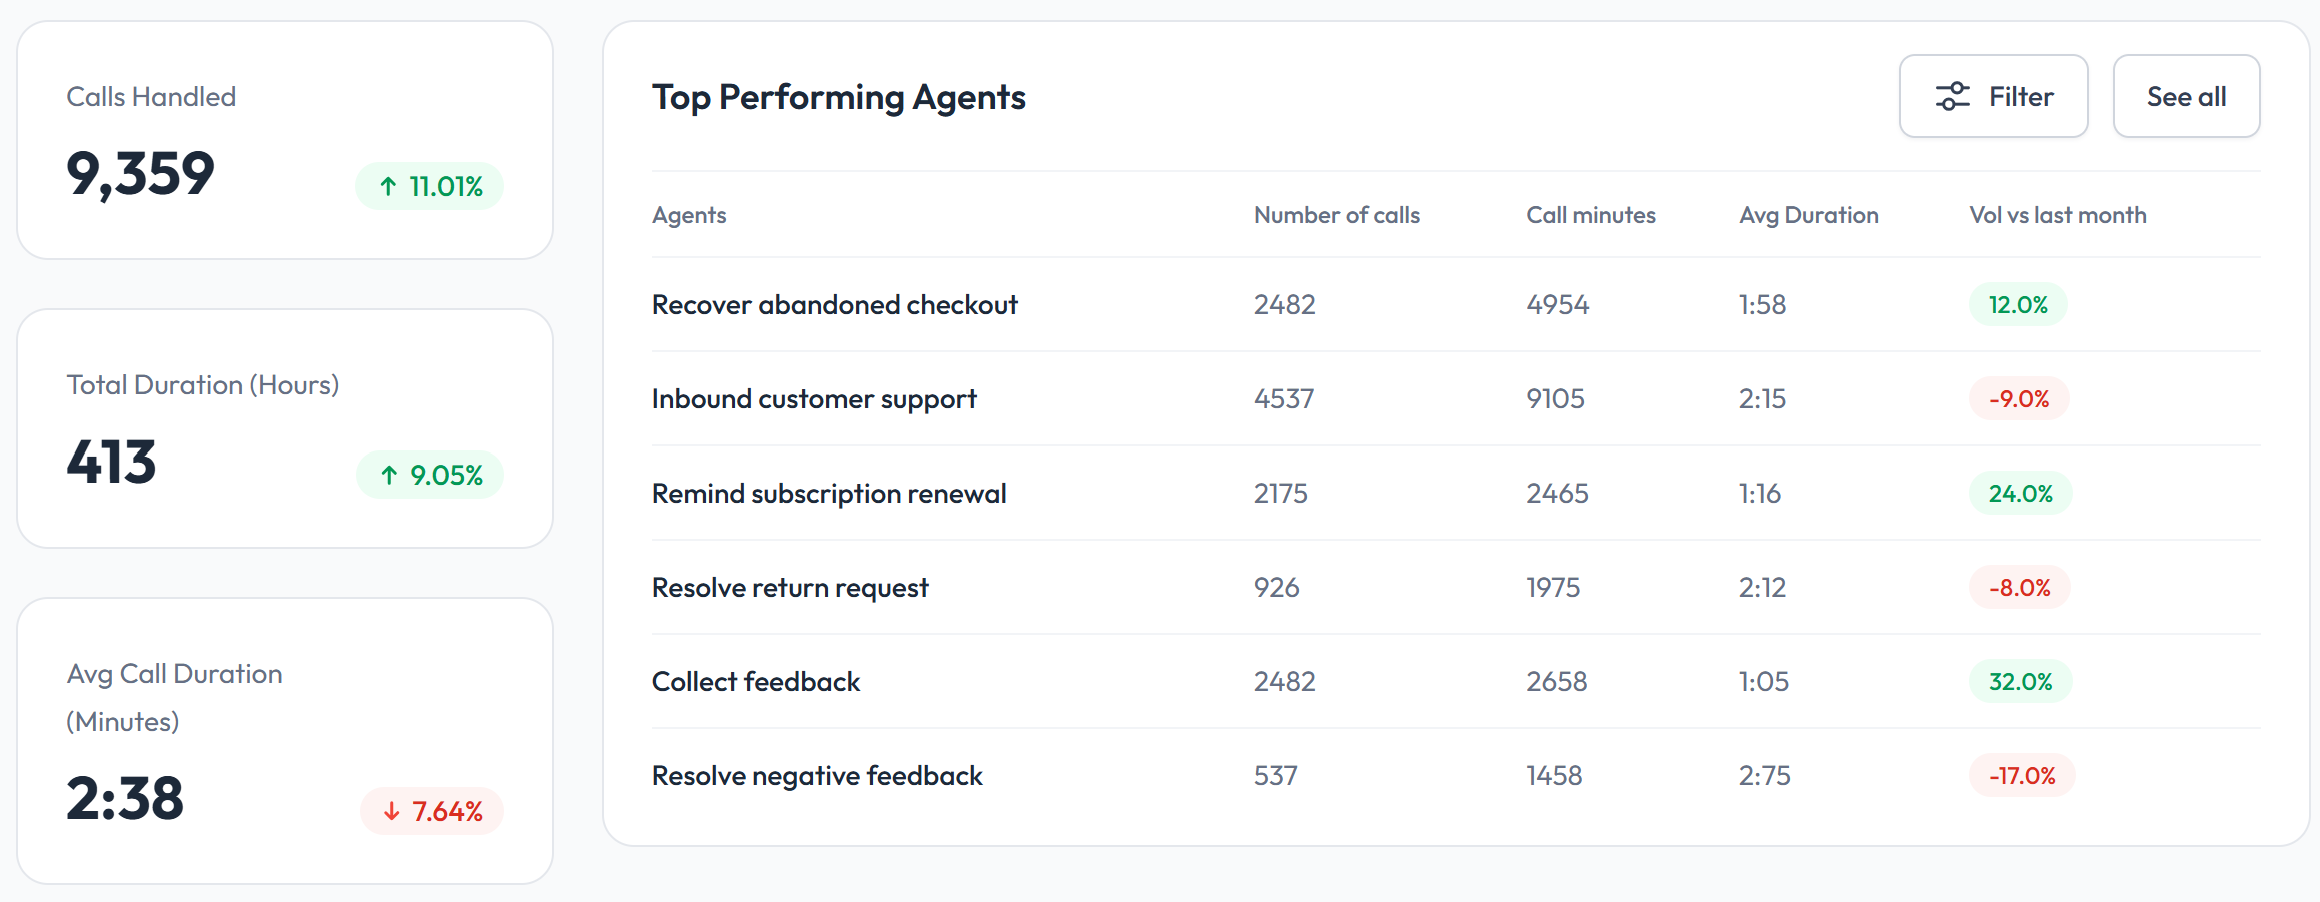
* Include total number of calls handled, total duration in hours of customer conversations, and avergae call duration in minutes.
* **Top Performing Agents** section enables you to compare the performance of all your agents across multiple metrics.
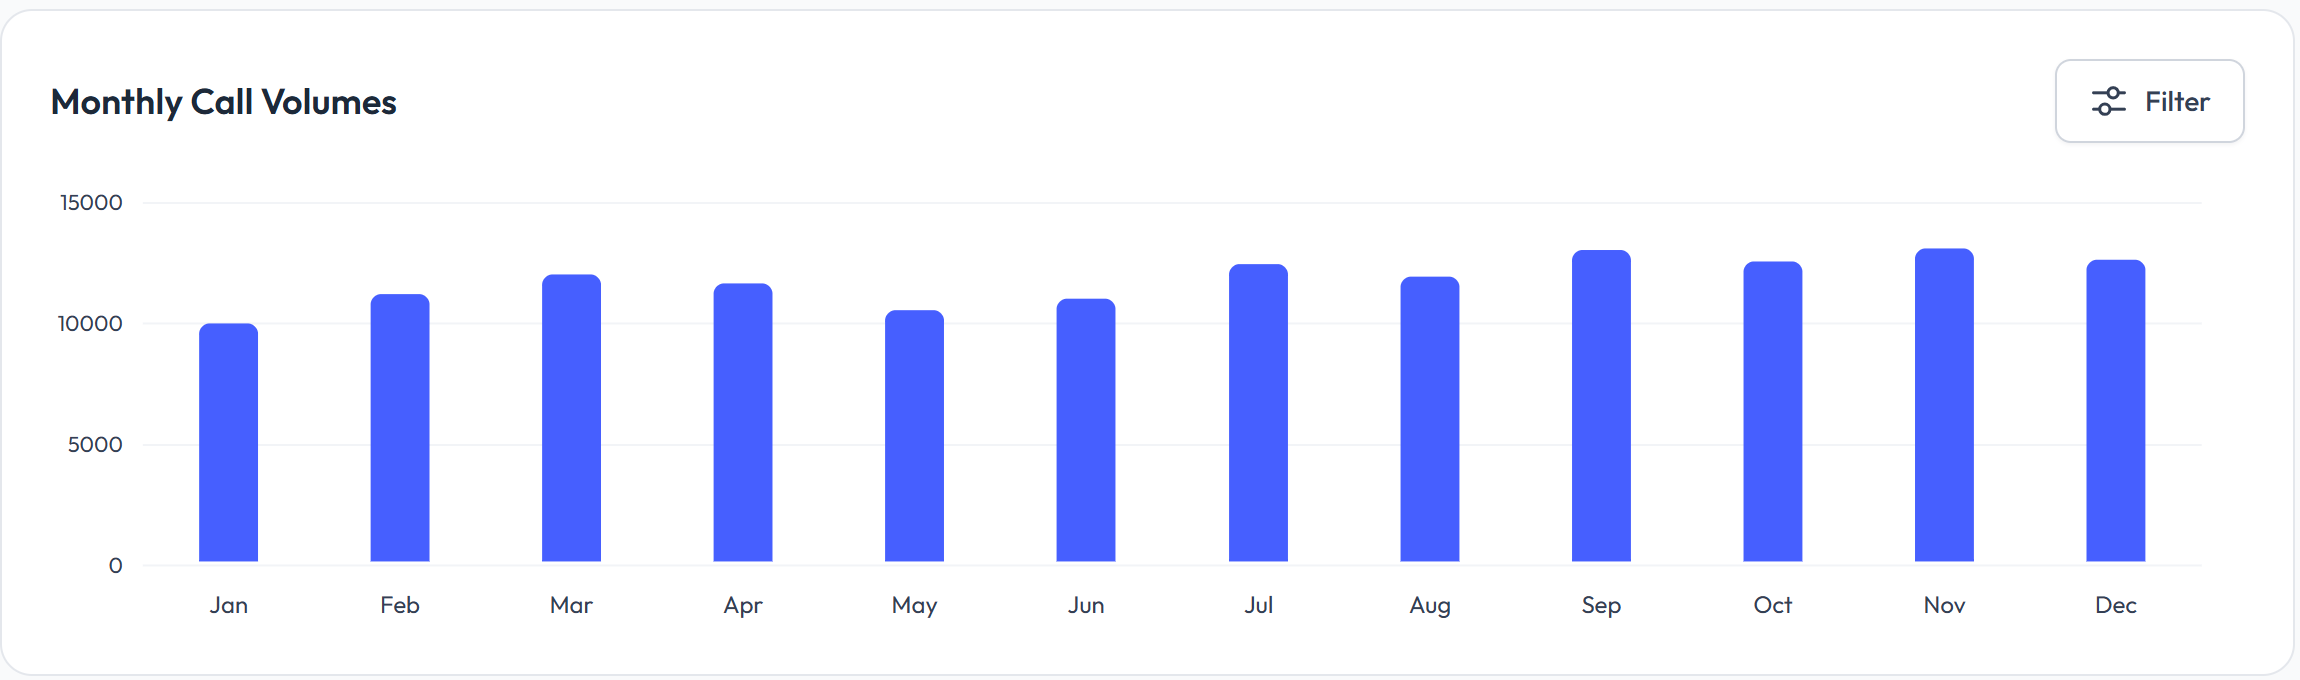
* Timeline view of **Call Volumes** (number of calls). Also allows filtering based on agent, call status, etc.
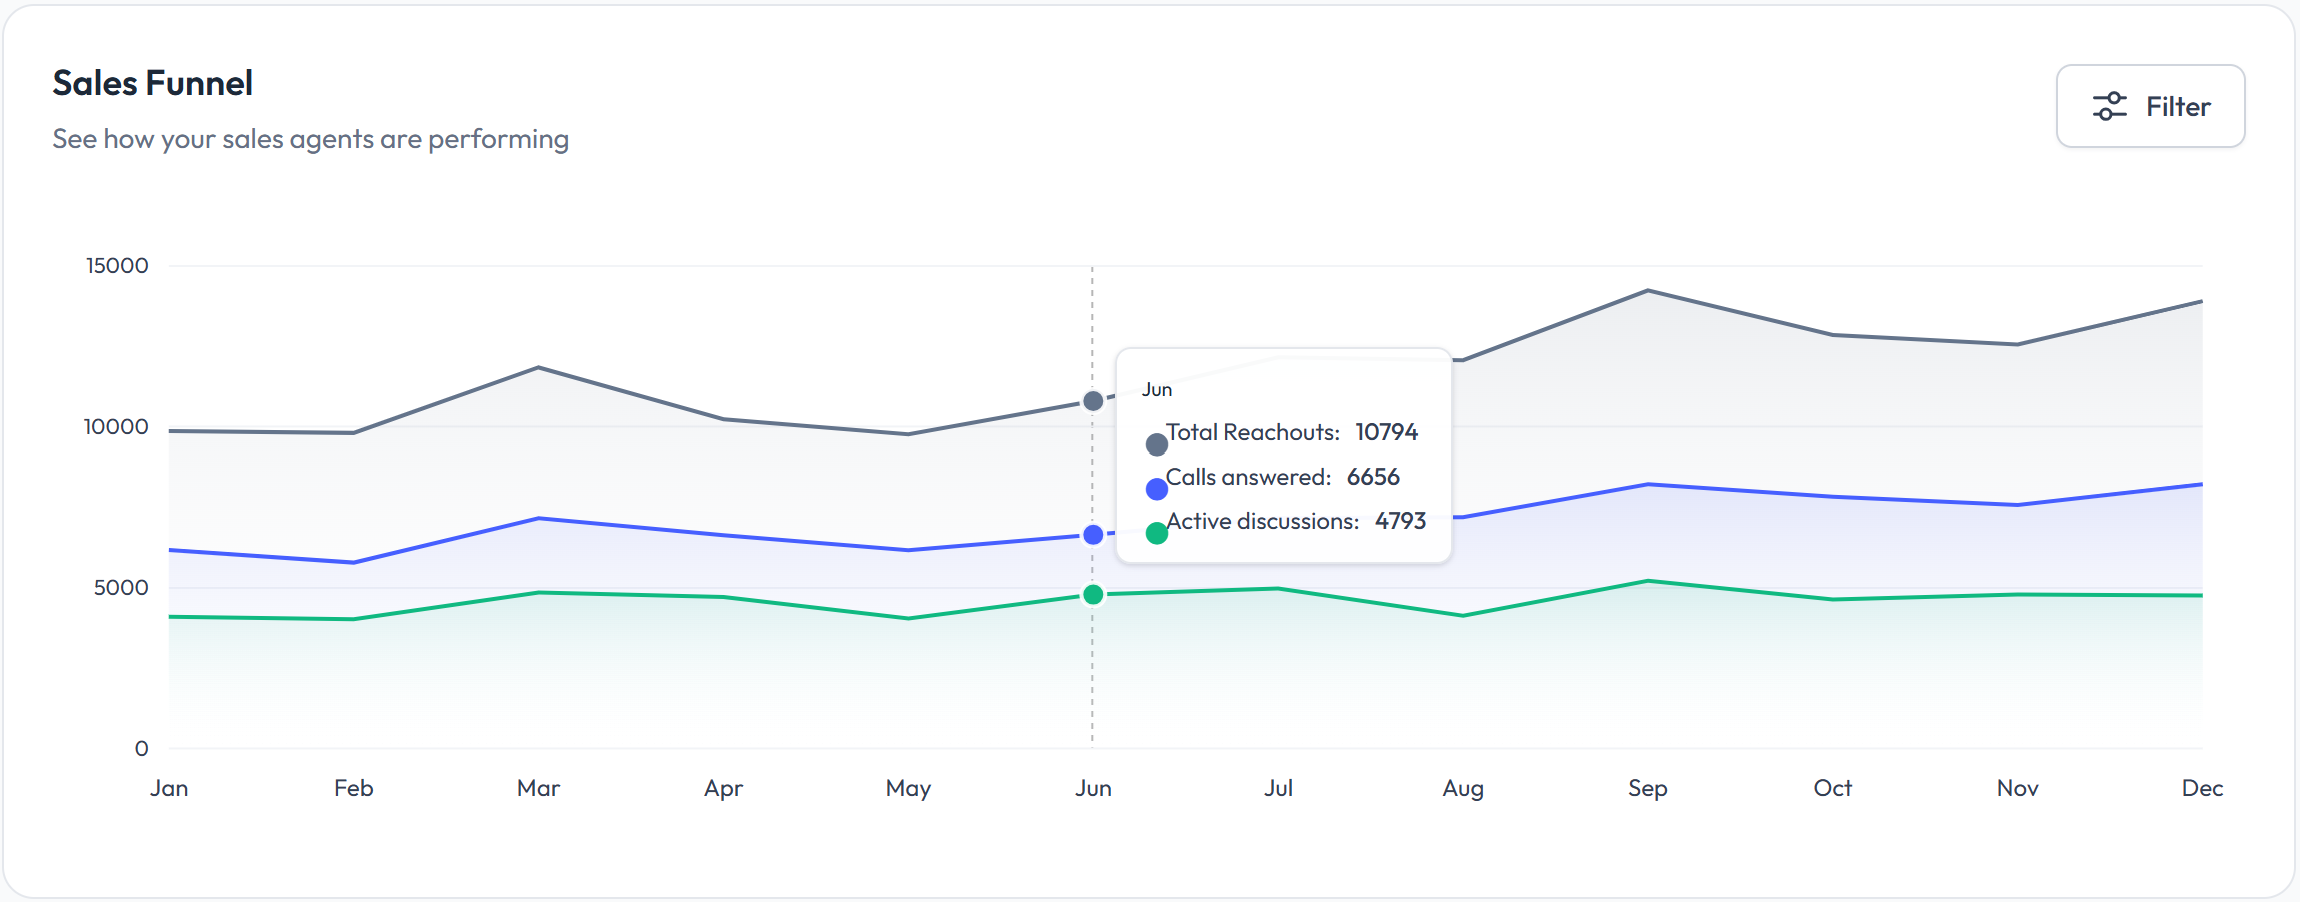
* **Funnel view** to see how your voice agents are performing. You can compare the efficiency across timelines as % calls answered and % active discussions. Also allows filtering based on agent, call status, etc.
Key metrics include:
* Include total number of calls handled, total duration in hours of customer conversations, and avergae call duration in minutes.
* **Top Performing Agents** section enables you to compare the performance of all your agents across multiple metrics.
* Timeline view of **Call Volumes** (number of calls). Also allows filtering based on agent, call status, etc.
* **Funnel view** to see how your voice agents are performing. You can compare the efficiency across timelines as % calls answered and % active discussions. Also allows filtering based on agent, call status, etc.